Using the statistics report to track database changes over time
Often overlooked, the Statistics report contains a wealth of useful information that is automatically recorded on your ChurchSuite account over time. There's a Statistics report in the Address Book and Children modules.
Address Book
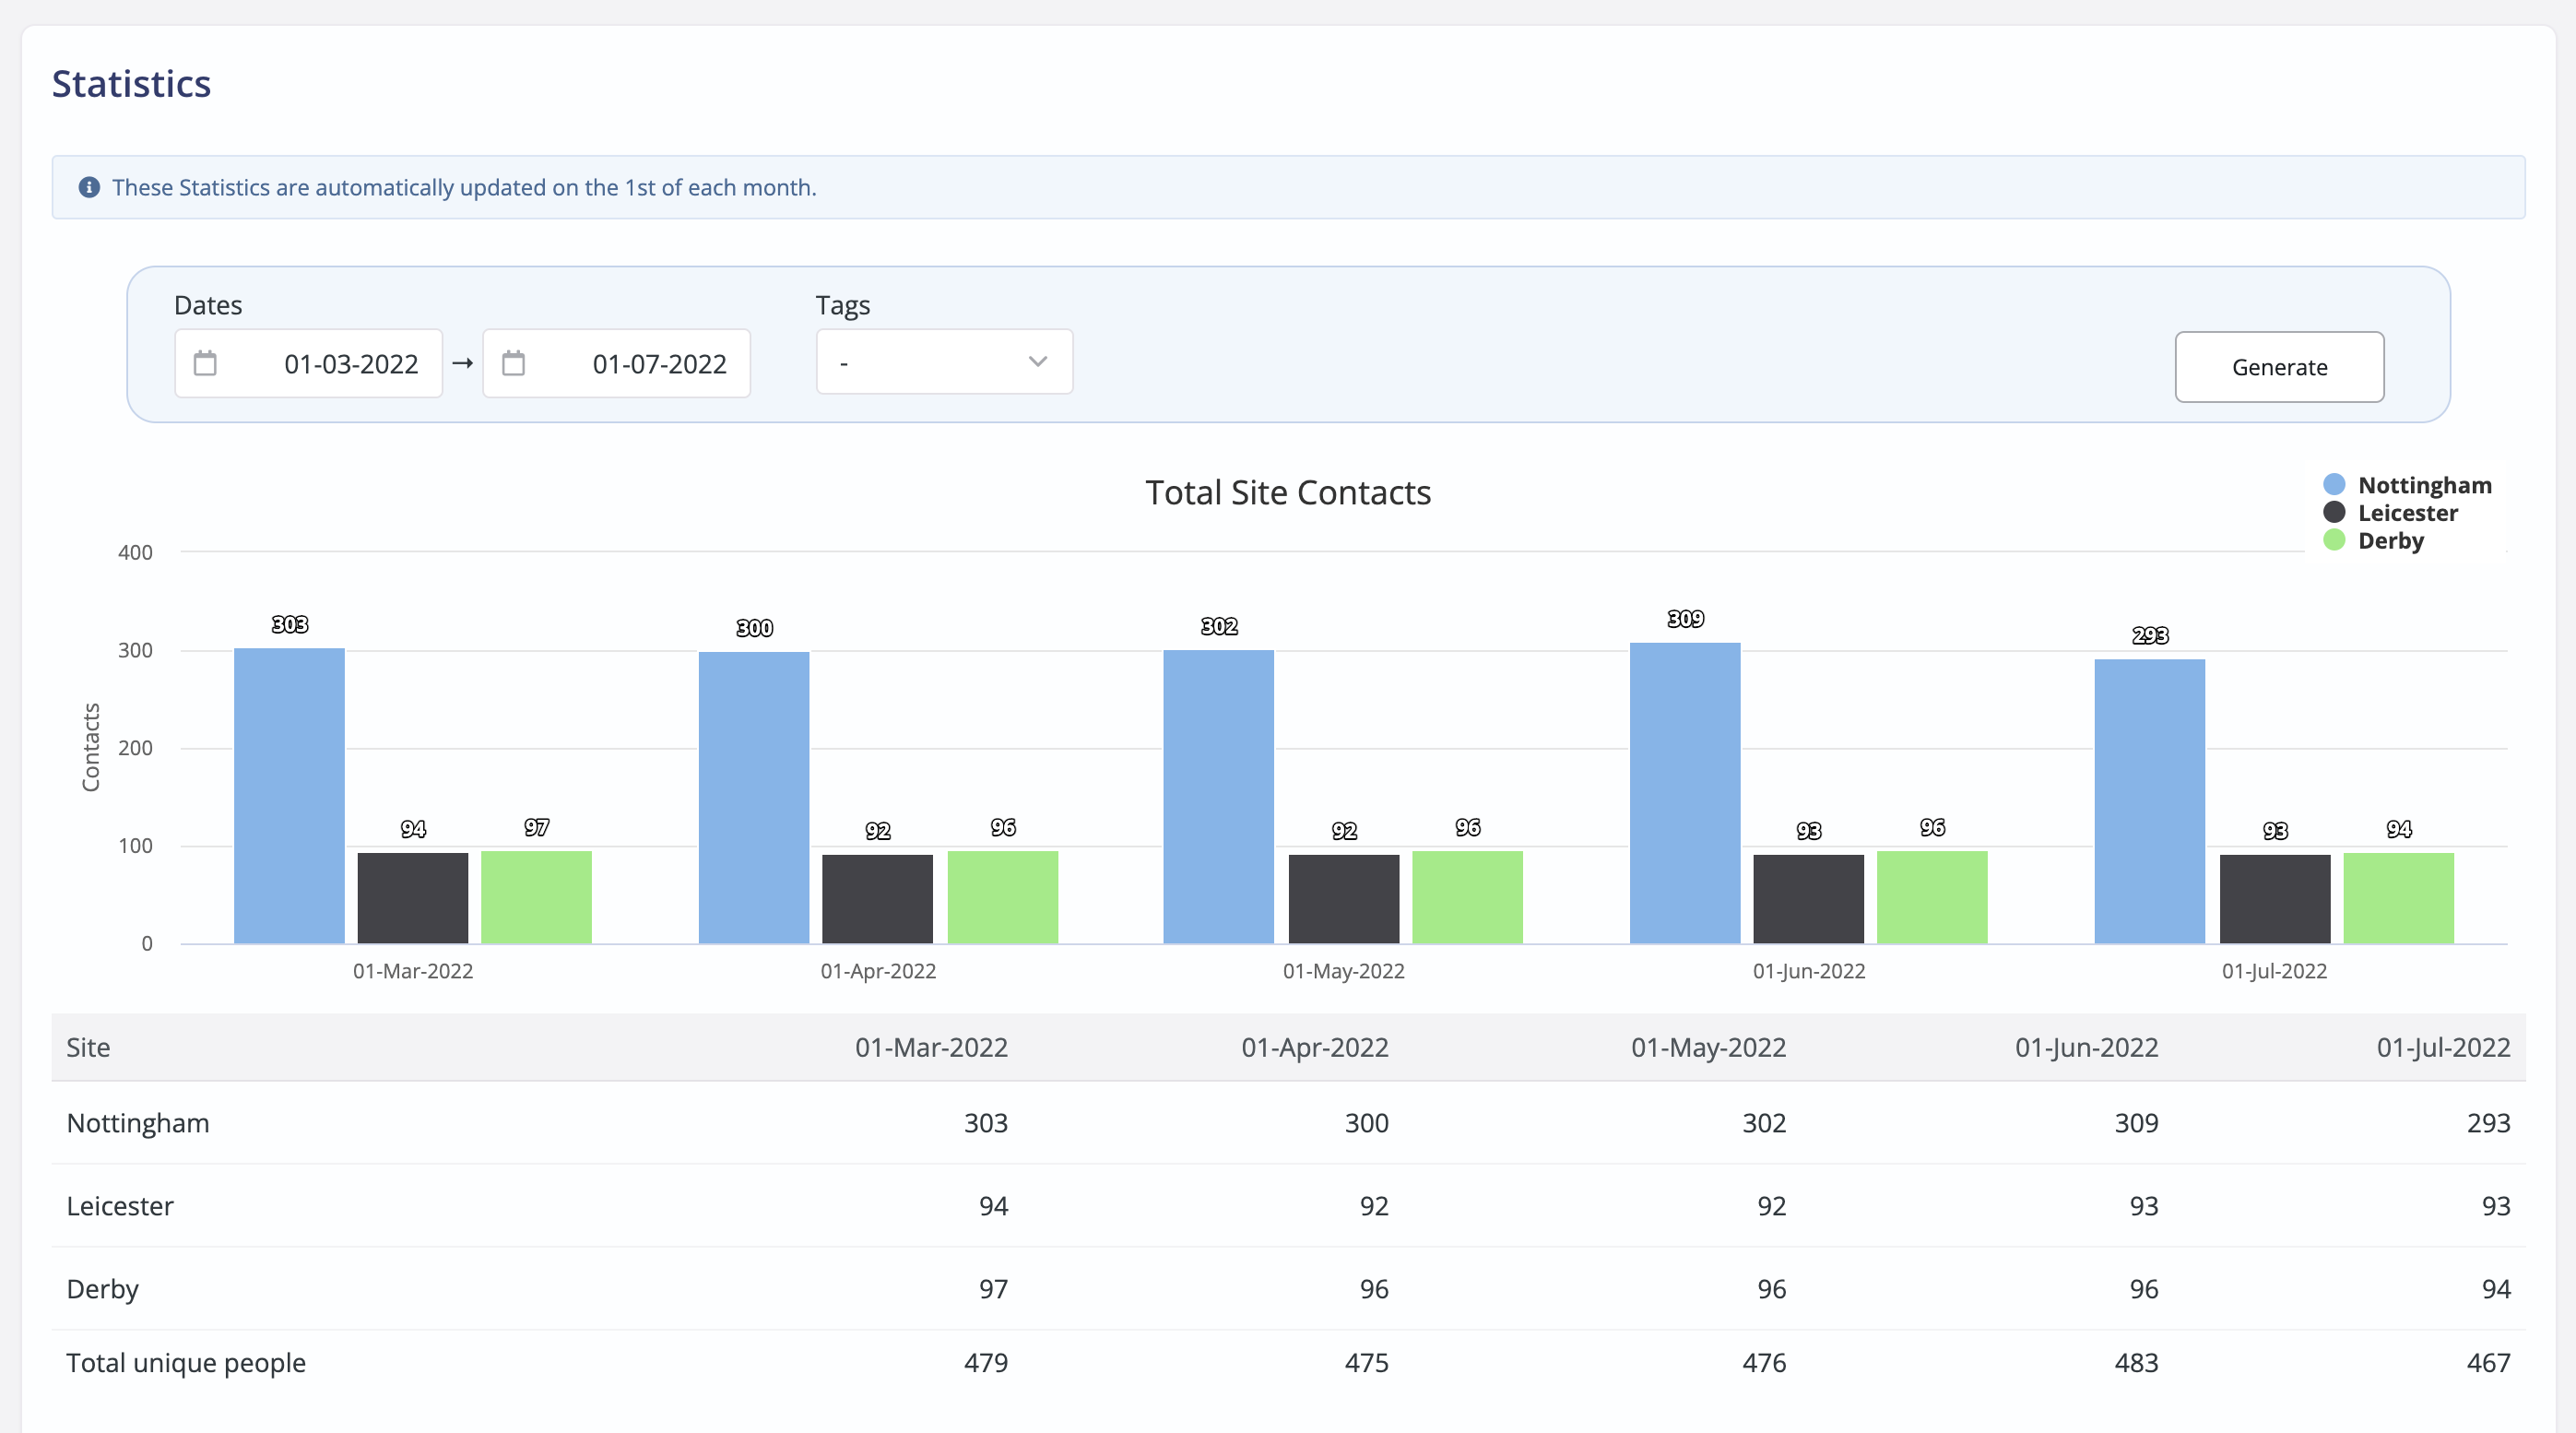
In the Address Book, the Statistics report primarily tracks the size of your Address Book over time, logging a record of the total number of active contacts for each site.
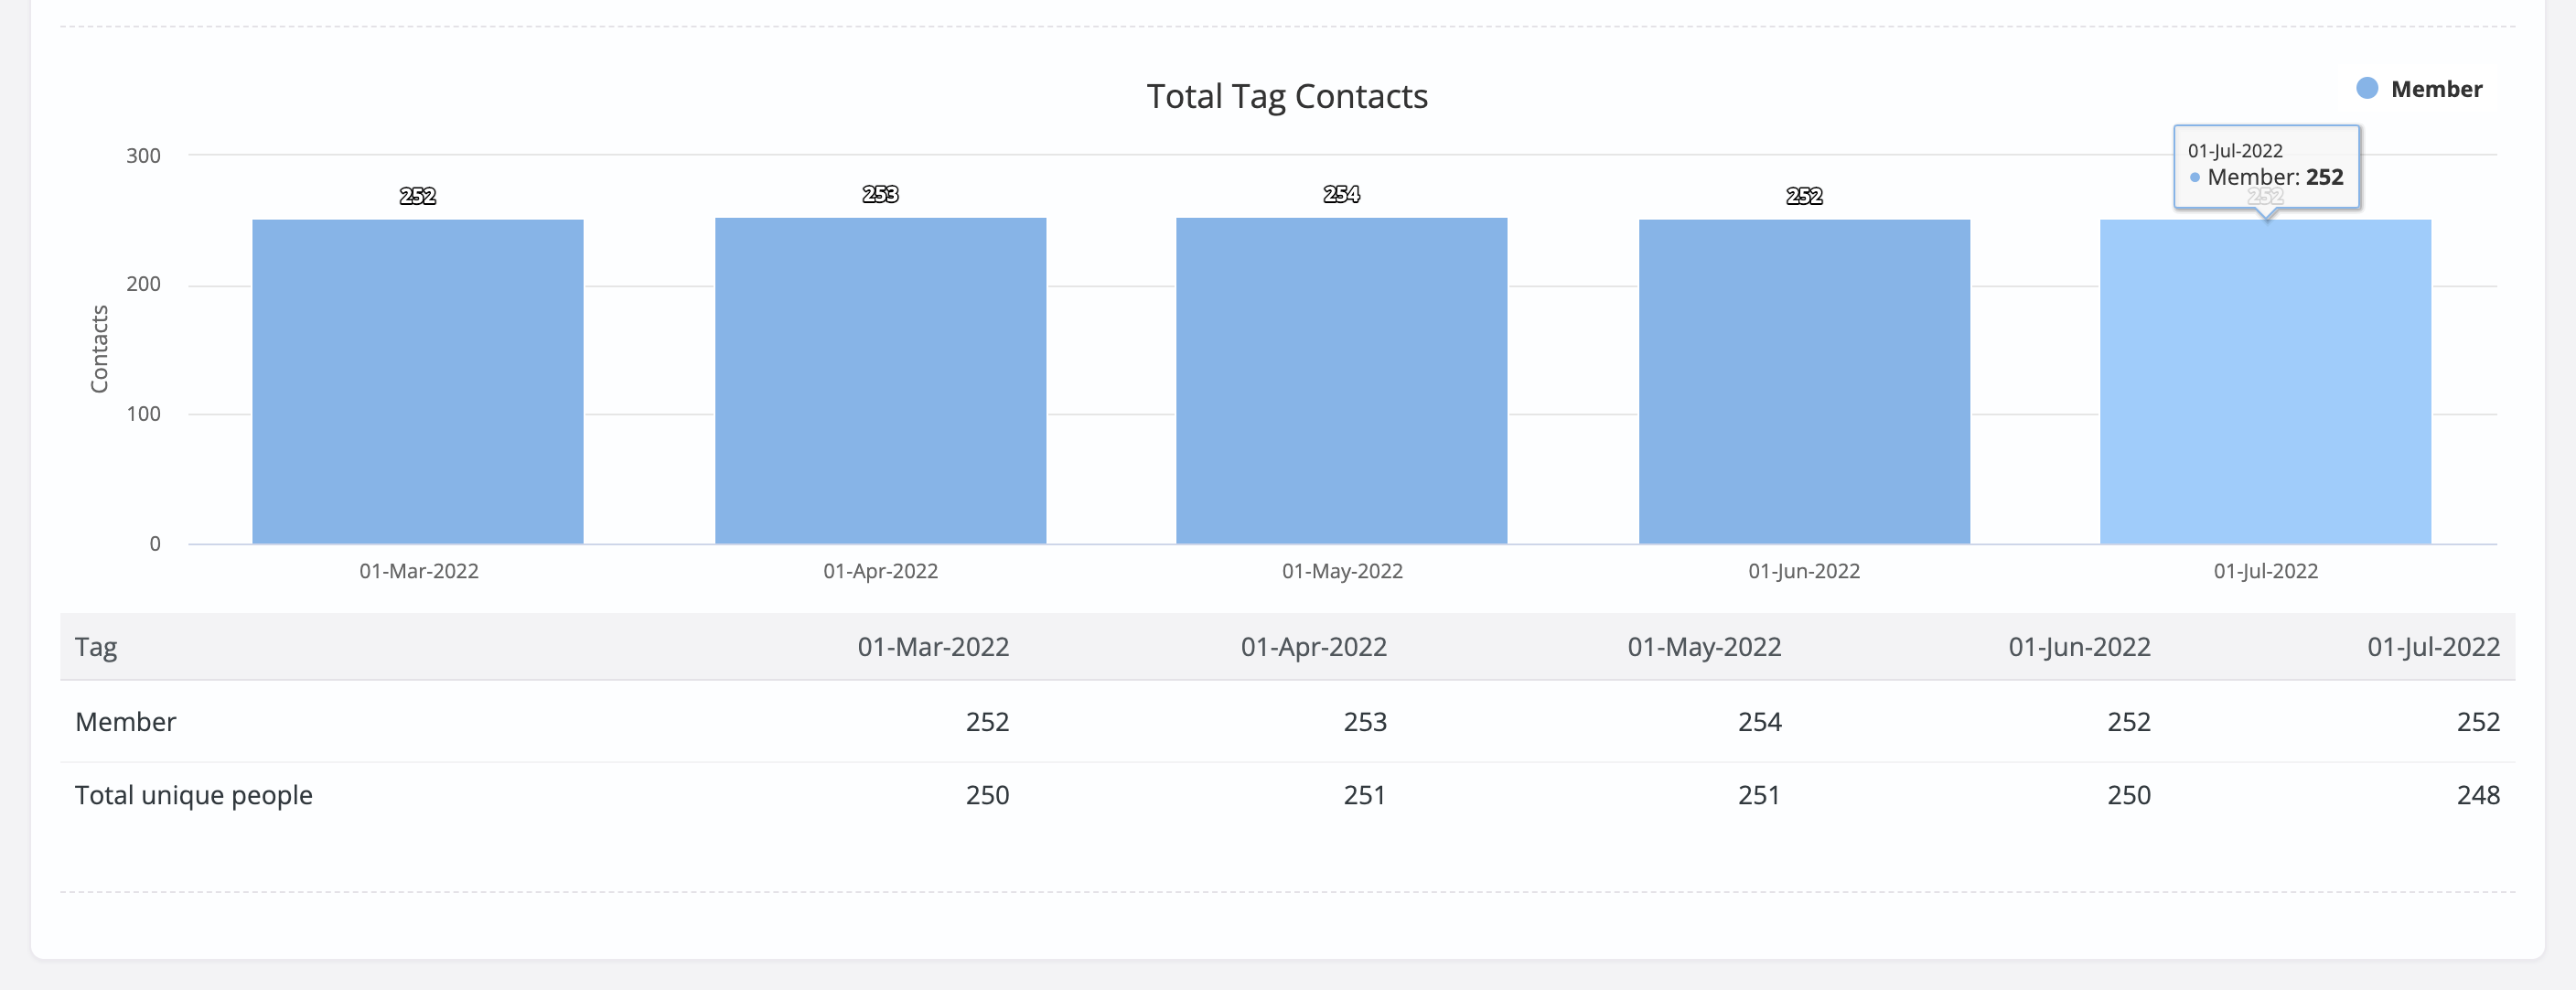
Scrolling down the page, under the Total Site Contacts graphs (shown above), is a snapshot of the size of each of your Address Book Tags too. Using the report's filter, you can view specific Tags within a range of Dates. Click Generate to apply the filters and update the results. For example, you might view a Members or Leaders tag to see if you have more members and leaders over time, or not.
For multi-site customers, the Statistics report shows the results based on the Site you are viewing. When viewing as All Sites you'll see the total Address Book contacts and the total contacts in filtered Tags or you can use the Site Selector to drill down into the data of a single site.

Statistics are automatically added on the first calendar day of each month with no user intervention required. This means that you can view the numerical change (growth or decline) of your Address Book and Tags over time, at any time.
When viewing the Statistics graphs for Total Tag Contacts and Total Site Contacts, notice how you can click on any of the Sites or Tags in the Graph Key to hide certain sites or tags from the graphs if you wish.

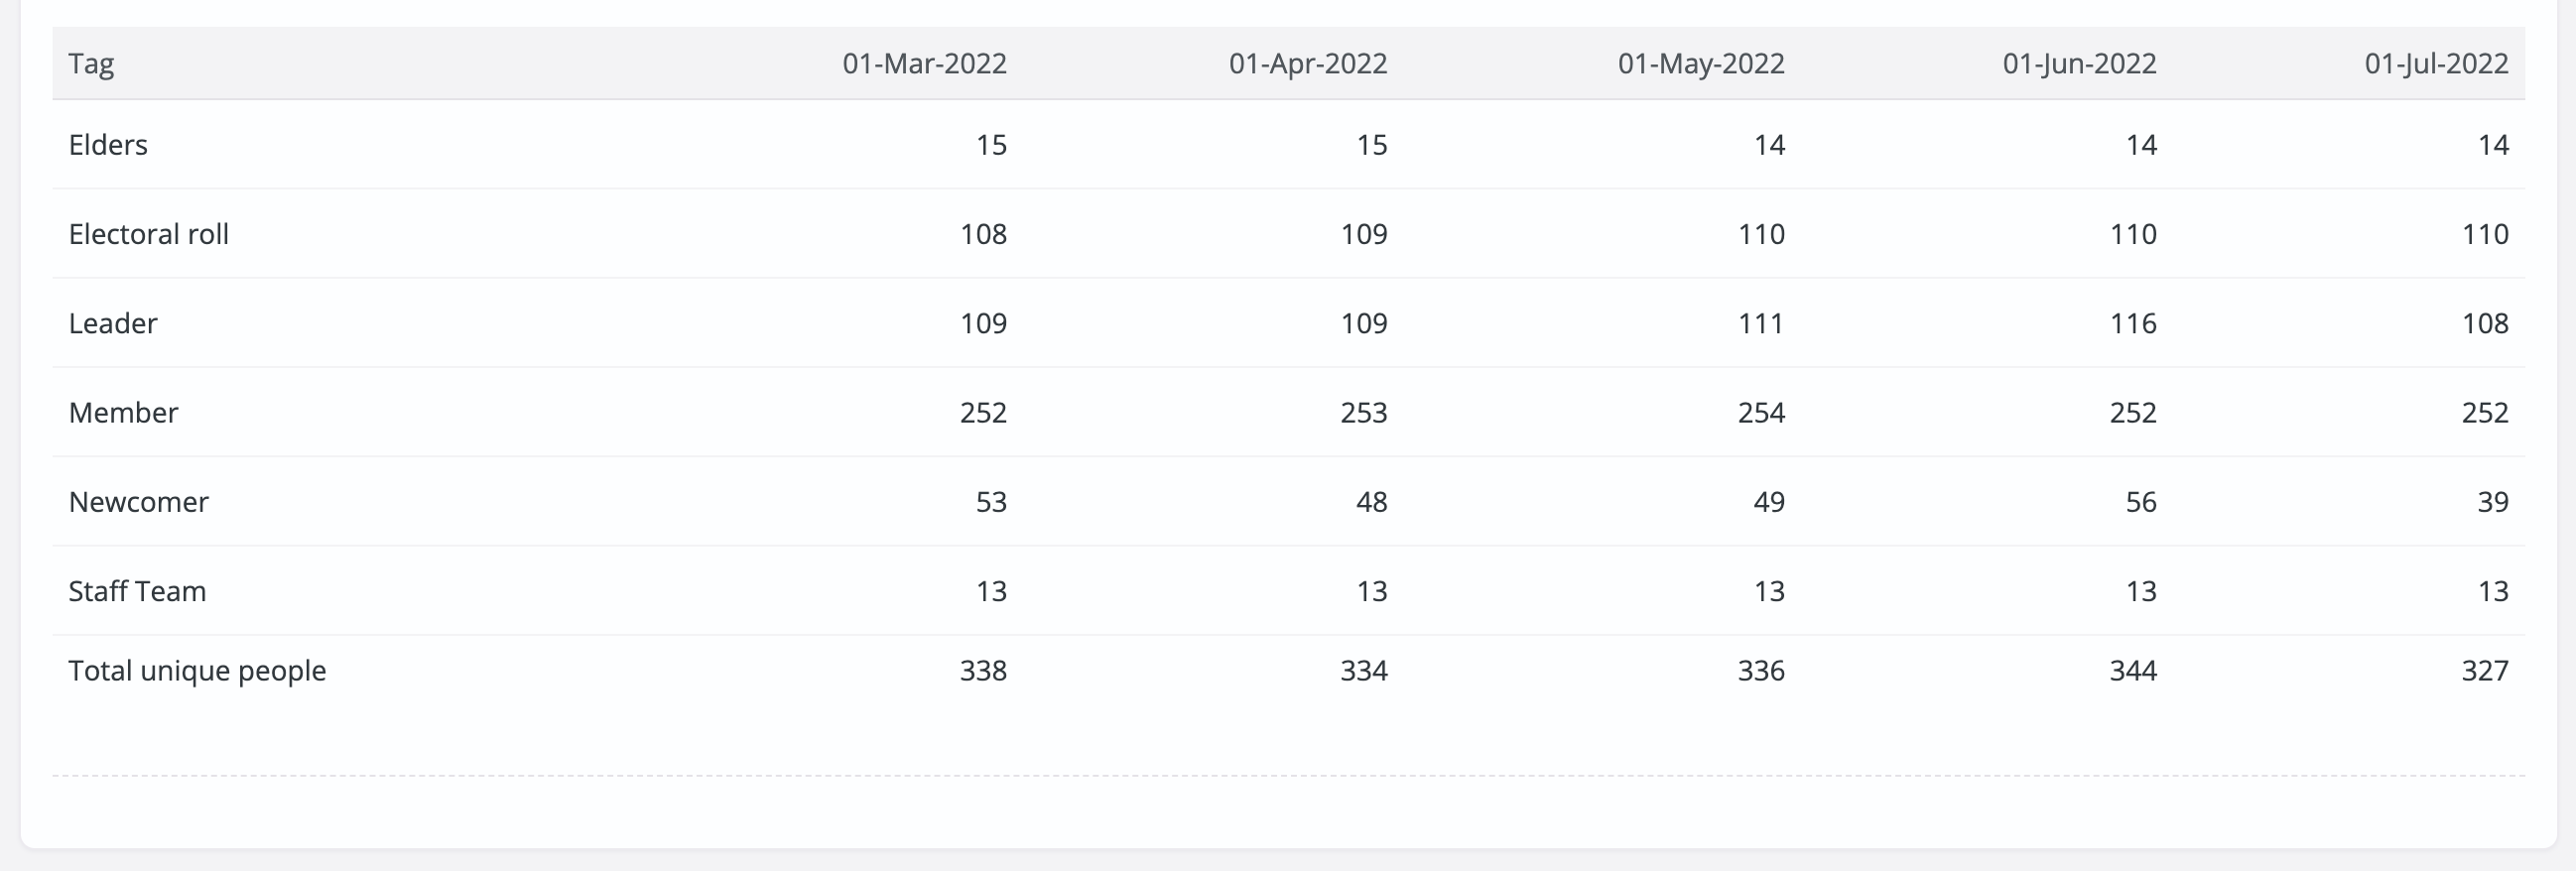
Since statistics are recorded for every tag and the tag list of many organisations will be quite long, the Tags filter will be especially helpful. Statistics are recorded for both Fixed and Smart Tags. Perhaps there are certain metrics that you could set up as Smart Tags for the express purpose of monthly statistic reporting? For example, you might create a Smart Tag with conditions for "In a Small Group", "In a Ministry", "Is a Leader", and "Is a Member" - and then let the Statistics report do all the hard work of taking a monthly snapshot of each of your measurable metrics.
Warning - Changes to Tag names
When a tag name is changed the statistics for the original tag name remain under the old name and a new set of statistics is created for the new tag name. The original statistics are still available under the 'Deleted tags' listed in the Tags filter. Note that it is not possible to delete statistics.
Children Module
In the Children module, the Statistics report works slightly differently, tracking and logging changes in the Children module
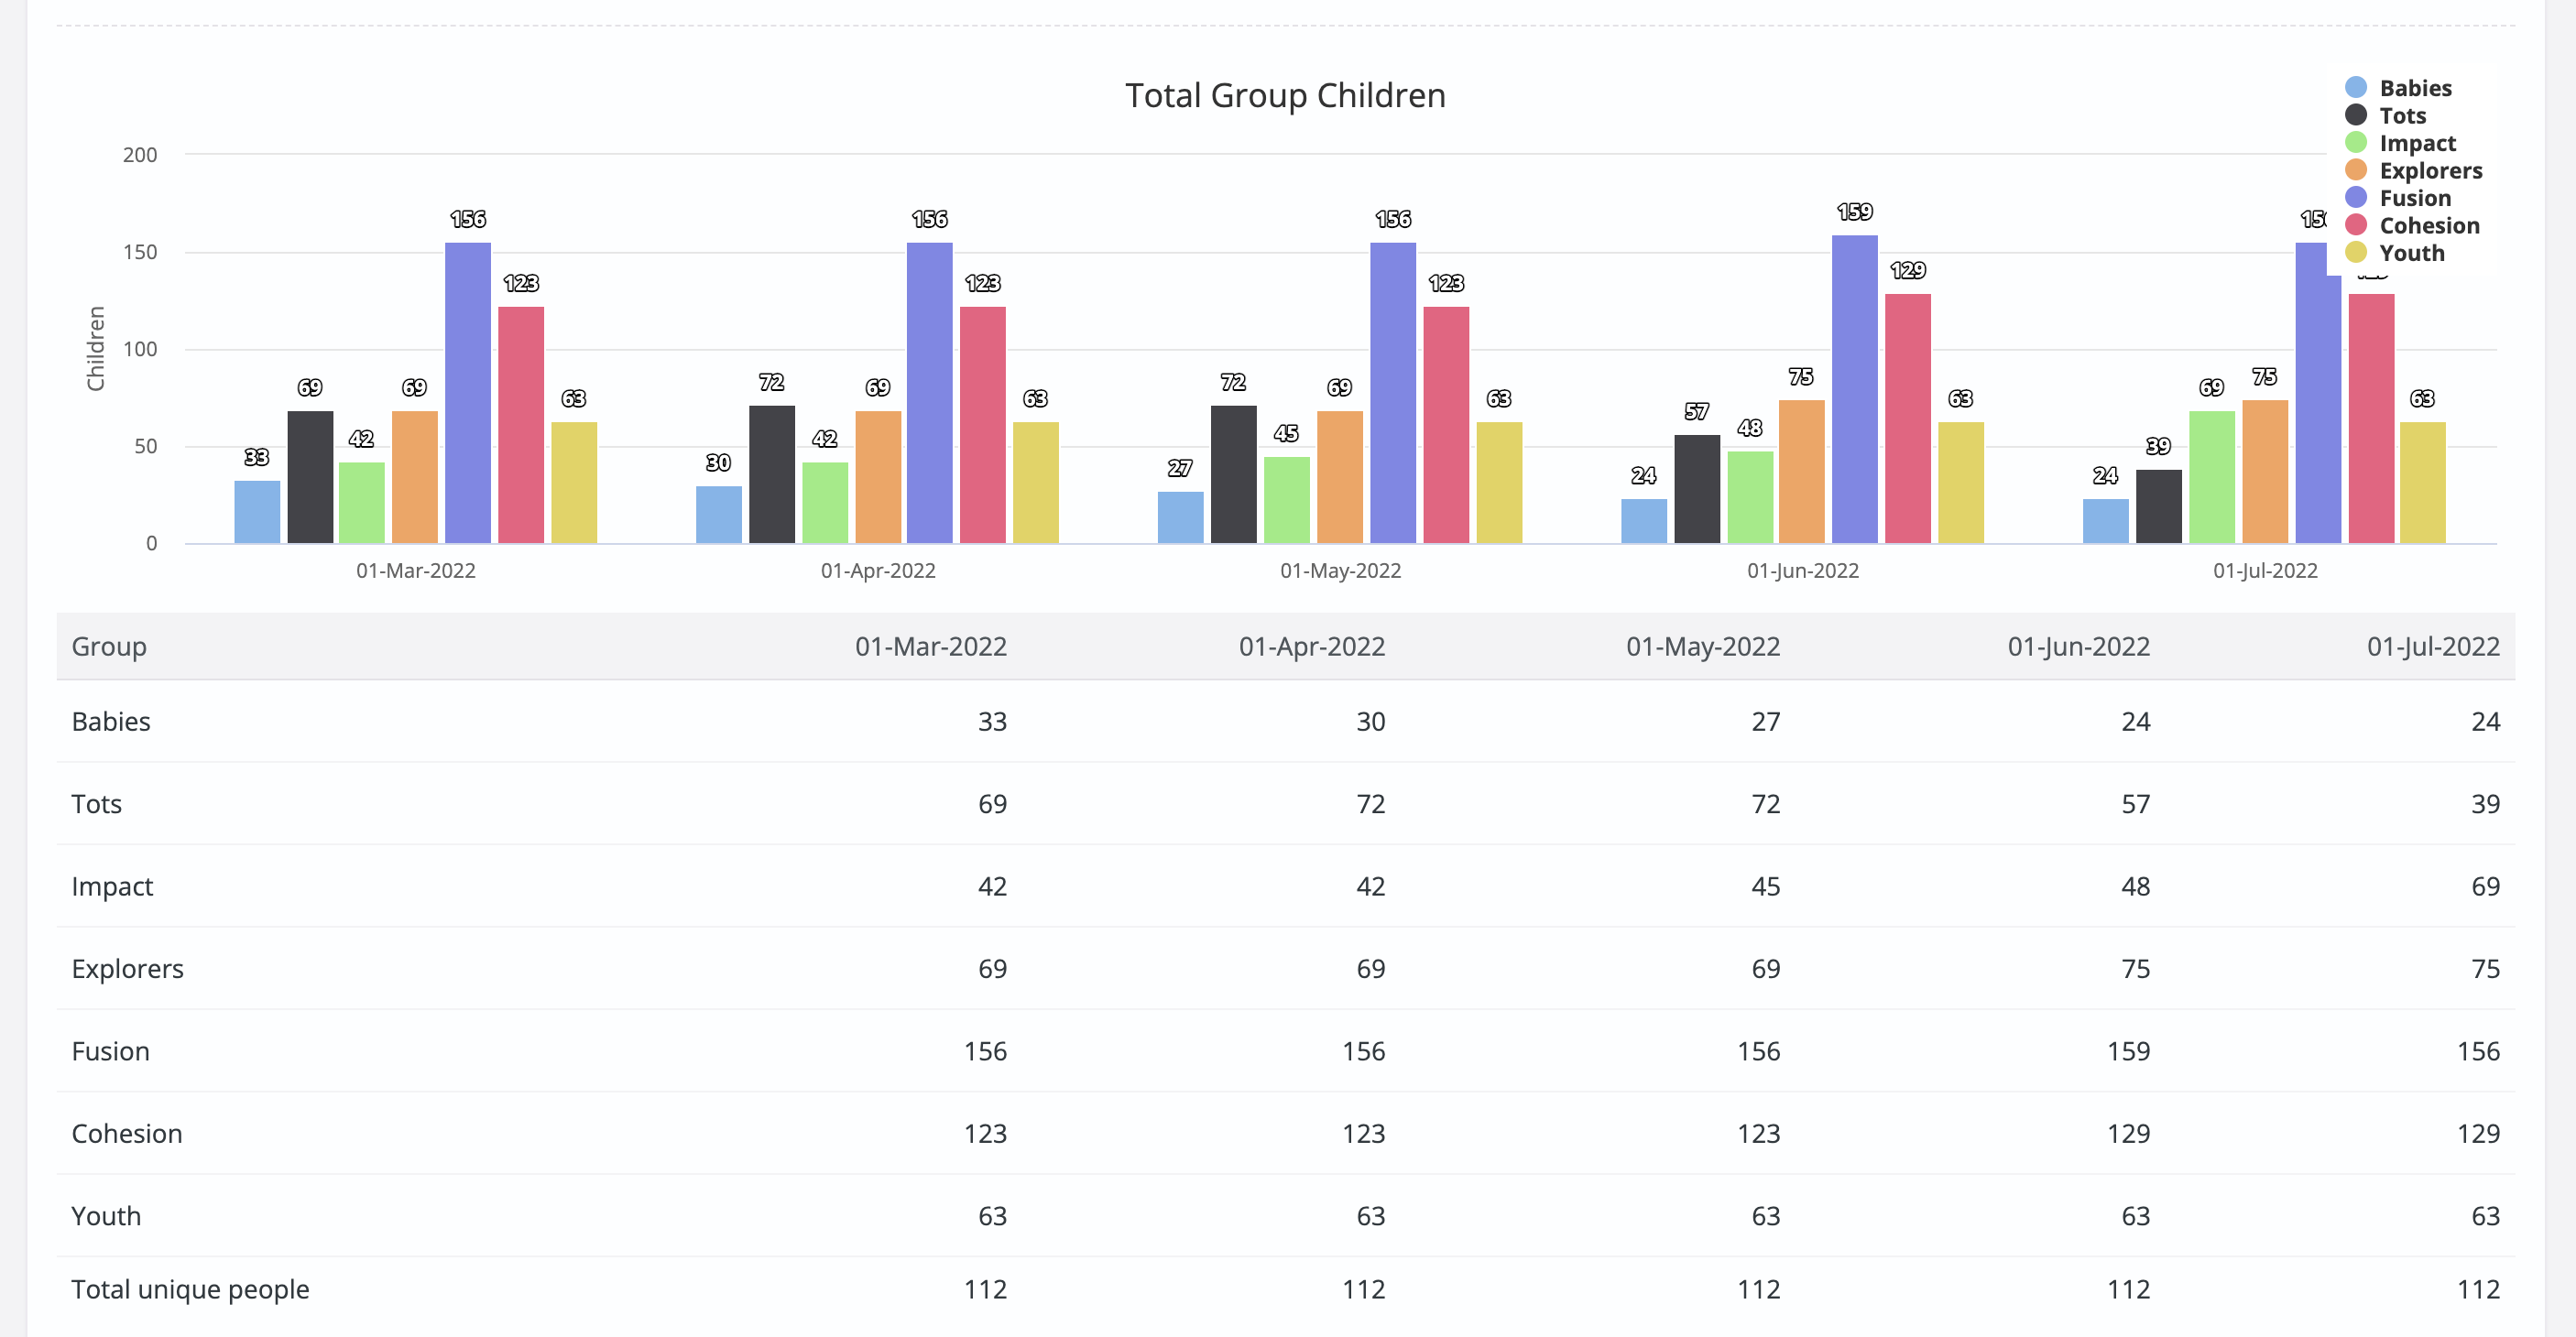
In the Children module, the Statistics report primarily tracks the size of your Children module over time, logging a record of the total number of active children in the module for each of your sites on the first day of each month.
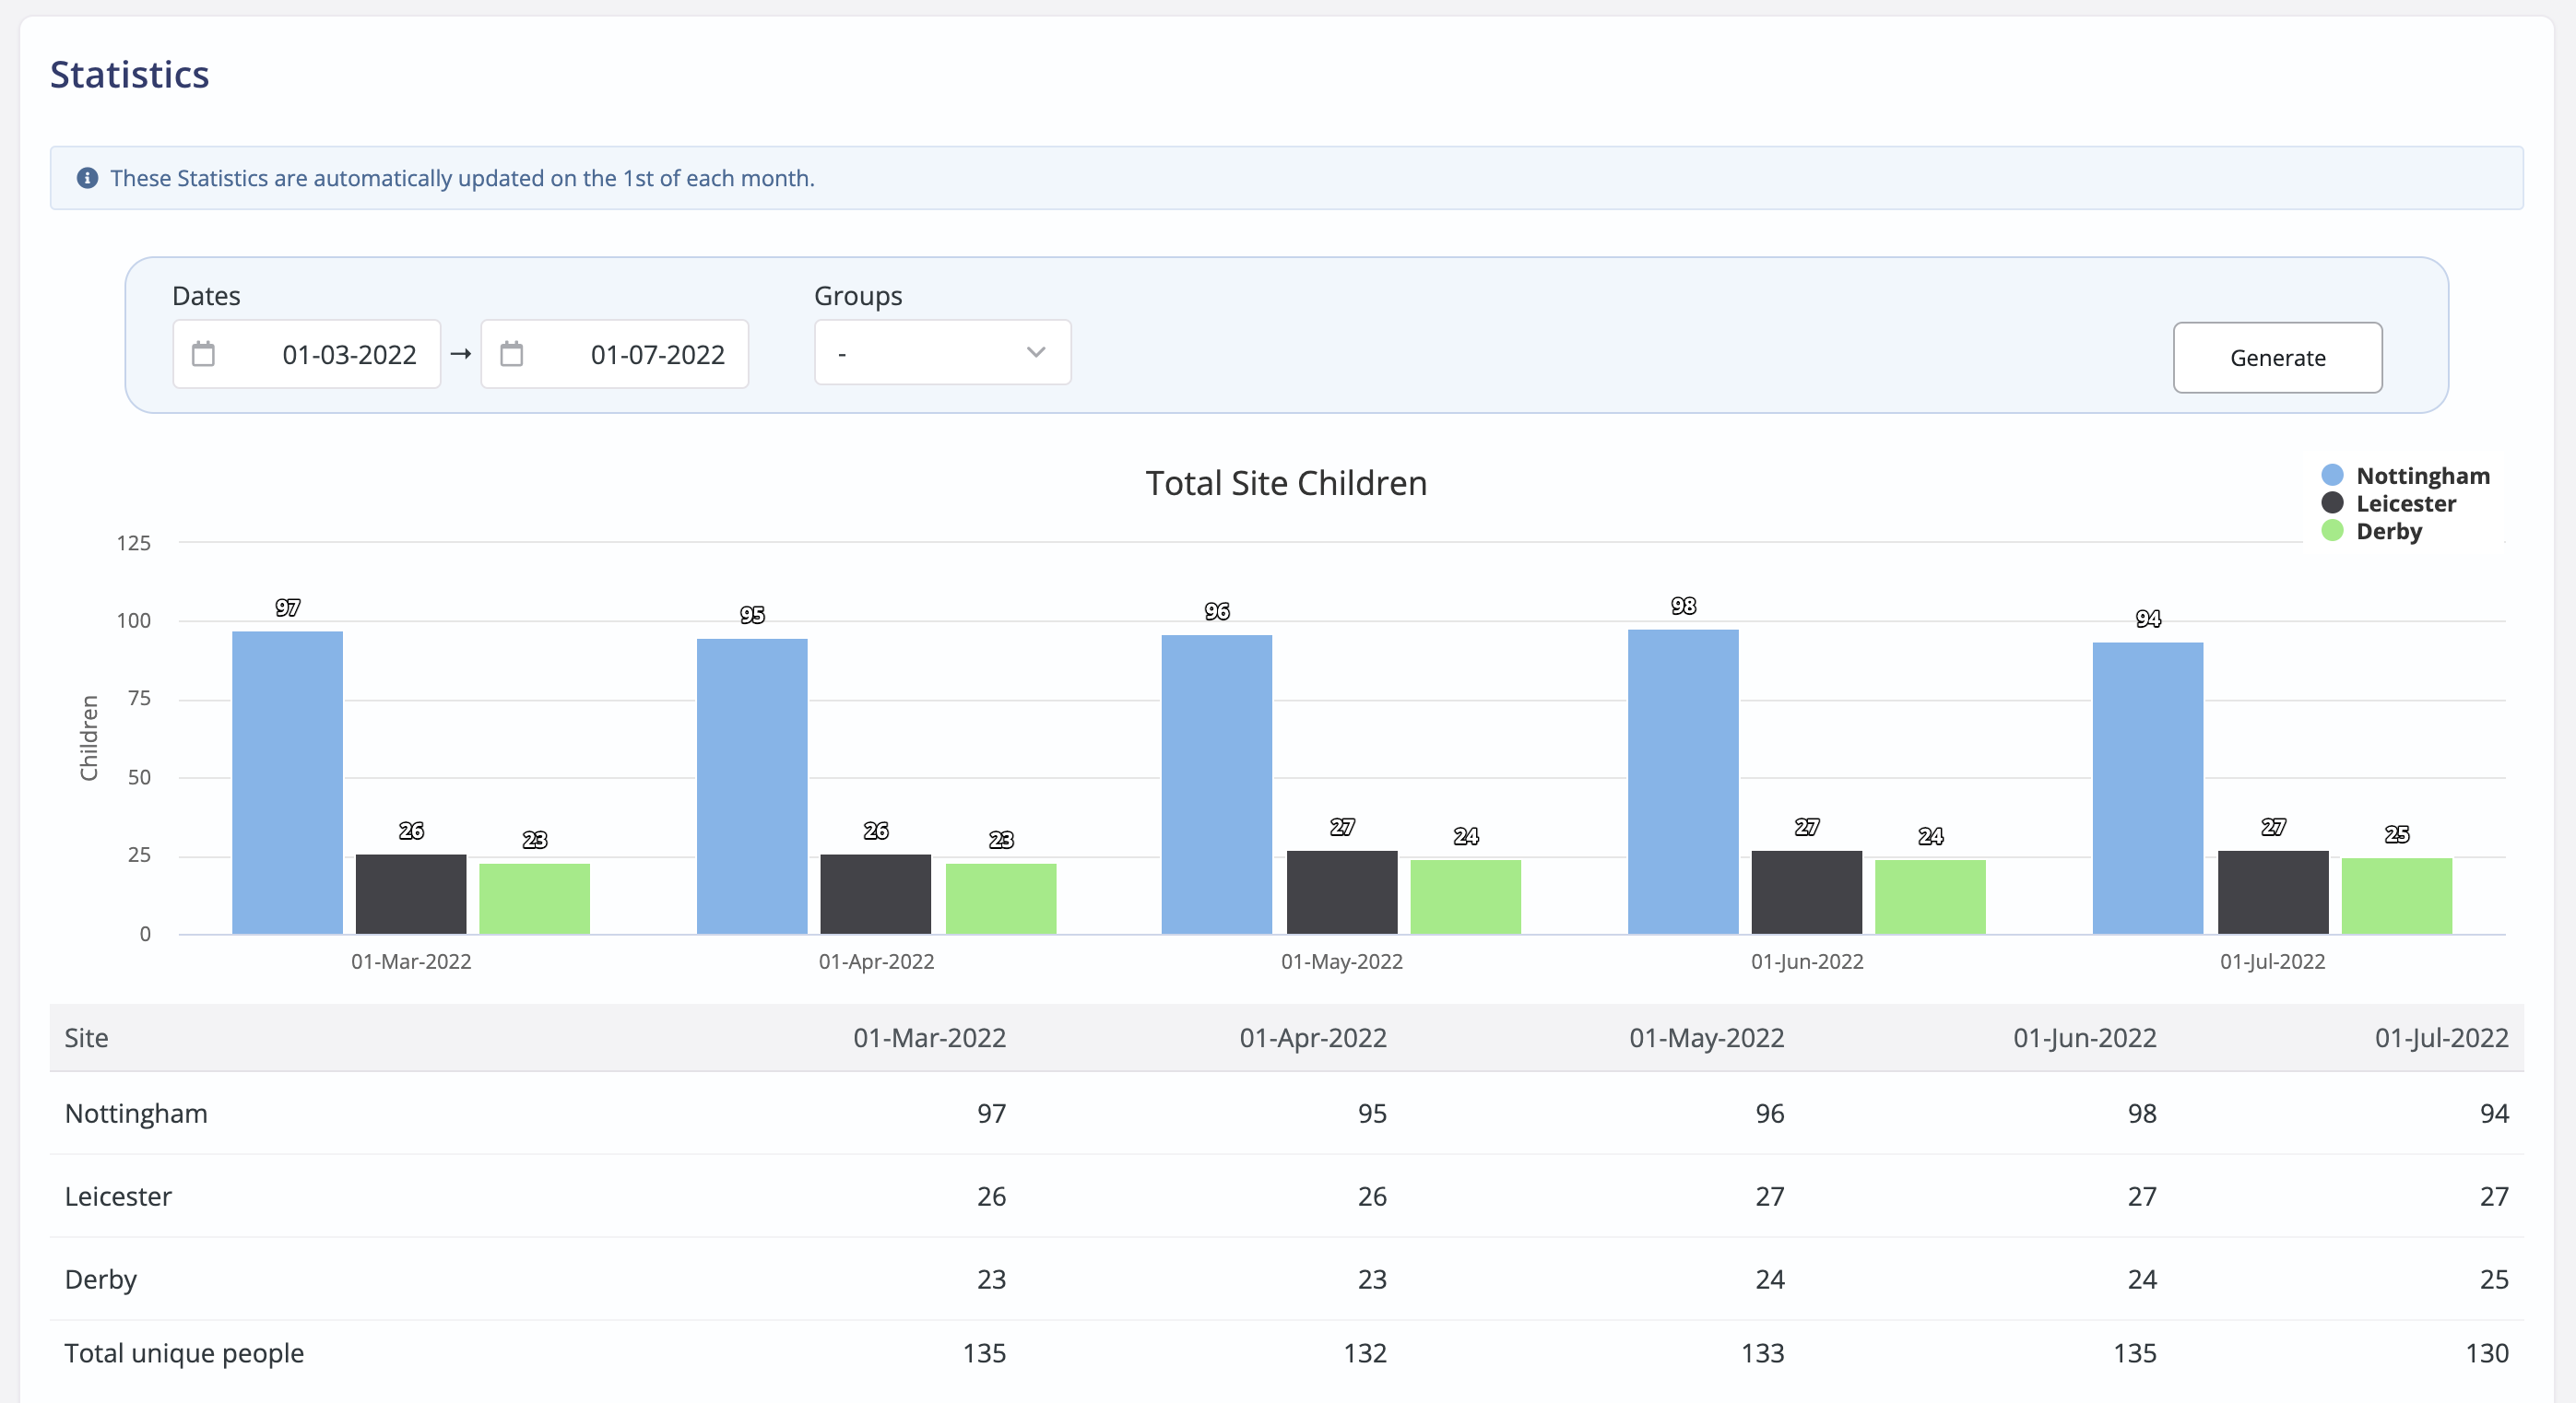
Scrolling down the page, under the Total Site Children graphs (shown above) you'll see that the system also records a snapshot of the size of each of your Children Module Groups. Using the report's filters at the top of the report you can filter for specific Groups within a range of Dates. Click Generate to apply the filters and update the results.
For multi-site customers, the Statistics report shows the results based on the Site you are viewing. When viewing as All Sites, you'll see the total Children module children and the total children in the filtered Groups or you can use the Site Selector to drill down into the data for a single site.

Statistics are automatically added on the first calendar day of each month with no user intervention required. This means that at any time you can view the numerical change (growth or decline) in the size of Groups over time.
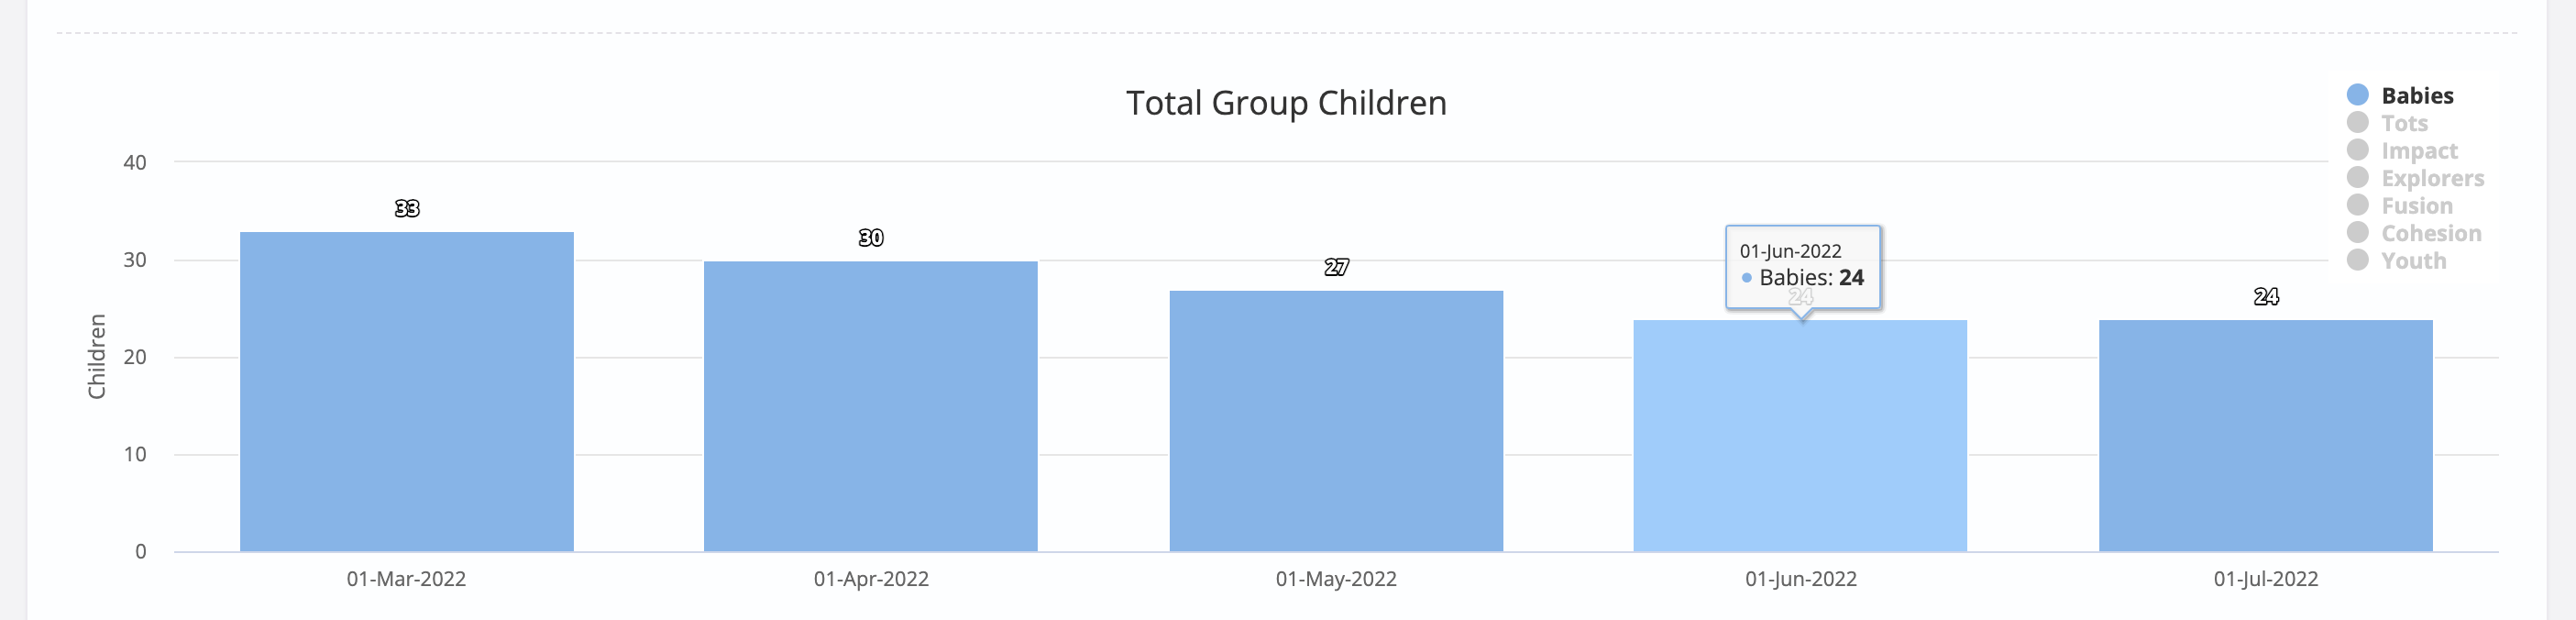
When viewing the Statistics graphs for Total Group Children and Total Site Children, notice how you can click on any of the Sites or Groups in the graph Key to hide certain sites or groups from the graphs if you wish.
Statistics are recorded for active groups only.
Top Tip - Printing
To print or save your statistics report as a PDF, you can use your in-built browser options by going to File > Print and then either printing or choosing the Save as PDF / Print to PDF option.